fMRI Lab
What is fMRI Data?
Welcome to the fMRI lab! We will be diving into fMRI data using Python/data science concepts. If you need to review these topics, please go over the optional Python Primer before starting this lesson.
To begin, we will introduce what fMRI data consists of and how it’s represented, and start looking at some sample fMRI data.
What does fMRI data look like?
In general, fMRI images are stored in the form of DICOM (Digital Imaging and Communications in Medicine) files. This format is used for medical images like Ultrasound or MRI/fMRI and can also contain patient identification information.
Oftentimes, for fMRI data analysis specifically, these DICOM files are converted into NIfTI files using dicomnifti. NIfTI stands for Neuroimaging Informatics Technology Initiative and the file formate was developed by the NIfTI Data Format Working Group to “facilitate inter-operation of functional MRI data analysis software packages.”
So how do you use these files? We will be using a python package called nibabel that can read these specific neuroimaging file formats (you can read more about it here).
First, you will need to import the necessary packages.
Importing and Setup
    import nibabel
    import os
    import numpy as np
    import csv
    import matplotlib.pyplot as plt
    import requests
Next, let’s take a look at an example fMRI image.
Import the data_path.
from nibabel.testing import data_path
This next step is to just find the right sample image. Make sure to include it in your code.
image_path = os.path.join(data_path, 'example4d.nii.gz')
Now, load the image using nibabel.load. When you call img, it should output the data type of the NIfTI image
Run the following lines of code and make sure it outputs: <nibabel.nifti1.Nifti1Image at 0x7f97ad41ba30>
As you can see, img is an instance of Nifti1Image. This object doesn’t actually directly store the actual fMRI data, but rather contains infomation about the fMRI data stored in the file which can be accessed by using attributes of the object.
For example, let’s look at the shape of the object using the .shape method:
img.shape
As you should be able to see, the shape is the image is in 4 dimensions: (X, Y, Z, T) where X, Y, and Z make up 3D space and T is time. So, this image has 2 time points each consisting of 24 horizontal slices that are 128 x 96 pixels in area.
Now, you can fetch the array data using the .get_fdata() method and run the cell below to look at the data type, shape, and array (which should just be an empty array).
    #Apply the .get_fdata() method to img and run cell to fetch array data into cache
    data = img.get_fdata()
    print('data type: ', data.dtype)
    print('data shape: ', data.shape)
    data
The array data associated with this example image is a 4-dimensional empty array, as desired. Now we can check to make sure the array data has been fetched into this image using the .in_memory method:
    #Apply the .in_memory method to img and run cell to check if array data is in cache (should return True)
    img.in_memory
Another way to look at image metadata is through the header attribute. The header of an image contains information on the image that can be accessed through get methods. Let’s take a look at this example image’s header:
    header = img.header
    print(header)
There are several easy commands that you can use to get specific attributes of this header. These are a couple examples and what they do:
get_data_shape() to get the output shape of the image data array (same as img.shape from earlier)
get_data_dtype() to get the numpy data type in which the image data is stored (or will be stored if you save the image)
get_zooms() to get the voxel sizes in millimeters
voxel_size[3] to get the 4th dimension of the scan: the time between scans in milliseconds
Transposing 4D fMRI Data
When working with fMRI data, it is actually more convenient for the data to be in (T, Z, Y, X) format (rather than (X, Y, Z, T)) for analysis. Thus, transposing the data is an important pre-processing step.
To do this, we simply use the transpose() command. Let’s try this on a simple 2D array first.
    #2D array of all zeros
    arr_2D = np.zeros((2, 3))
    print(f'Original array shape: {arr_2D.shape}')
    arr_2D

    #Transpose command
    arr_2D_transposed = arr_2D.transpose() #Alternatively arr_2D.T does the same thing
    print(f'Transposed array shape: {arr_2D_transposed.shape}')
    arr_2D_transposed
Now what about a 3D array?
    #3D array of all zeroes
    arr_3D = np.zeros((2, 4, 3))
    print(f'Original array shape: {arr_3D.shape}')
    arr_3D
What do you think the transposed dimensions will be?
    #T command
    arr_3D_transposed = arr_3D.T
    print(f'Transposed array shape: {arr_3D_transposed.shape}')
    arr_3D_transposed
Tranposing the 3D array inverted the order of the original array dimensions! Now we can see how the transpose command can be used to transform fMRI data from (X, Y, Z, T) to the more useful format of (T, Z, Y, X). Let’s try it with the array data we fetched for the example image before:
    #Recall the empty 4D array of image data from before with shape:
    print(f'Original image data shape: {data.shape}')

    #Apply either transpose method to data, transposed data shape should be (2, 24, 96, 128)
    m = data.shape
    array1 = np.zeros(m)
    data_transposed = array1.T
    print(f'Transposed data shape: {data_transposed.shape}')
So, as a summary: so far, we have learned how to use the python package nibabel to load fMRI images and datasets. Then we looked into an fMRI example image and used the get_fdata() method to fetch the 4D data array for the image and cache it in the image memory. We also explored some other attributes that contain more information about the image. Lastly, we talked about how to transpose the fMRI image data to invert the dimensions using the .transpose() and .T commands. This will become more important as we dive deeper into working with actual fMRI data.
Real fMRI Datasets
Now, we will load and save an fMRI experimental dataset and take a deeper dive into masking, visualizing, and working with a dataset.
First step is exploring the dataset: we will be using a subset of the data from the study Neural Processing of Emotional Musical and Nonmusical Stimuli in Depression from Lepping et al. 2017. We downloaded the data from public database openneuro.org, feel free to explore other datasets on their page!
    # Download data
    url = 'https://github.com/neurotech-berkeley/neurotech-course/blob/master/module_3_fMRI_dataset/sub-control01/sub-control01_func_sub-control01_task-music_run-1_bold.nii?raw=true'
    r = requests.get(url, allow_redirects=True)
    open('sub-control01_func_sub-control01_task-music_run-1_bold.nii', 'wb').write(r.content)
    file_path = './'
    image_path = os.path.join(file_path, 'sub-control01_func_sub-control01_task-music_run-1_bold.nii')
Let’s take a look at the first image: a Never Depressed (ND or control) patient completing the music task.
    control01_music_img = nibabel.load(image_path)
    control01_music_img

    # The NIFTI image consists of 105 time points each containing 50 horizontal slices that are 80 x 80 pixels in area
    control01_music_img.shape


    # Apply the .get_fdata() method to the image we loaded above and run cell to fetch the array data
    control01_music_data = control01_music_img.get_fdata()
    control01_music_data

    # Print a summary of all relevant information
    print(control01_music_img.header)
Now, a figure out how to transpose this image to the correct format
4D fMRI Data Manipulation
Ok so now we have a 4-dimension array of fMRI data. Remember that this is essentially a 4D scan containing volumetric/voxel data over a series of time points.
Indexing
Using the transposed data, we can isolate the voxel time series data by looking at a single voxel, say (1, 1, 1) over all of the time points. Remember that time is the first dimension:
    first_time_series = transposed_data[:, 1, 1, 1]
    print(first_time_series.shape)
    first_time_series
Mean
When working with 4D fMRI data arrays, it can be useful to take a descriptive statistic across time series values especially for pre-processing. For example, taking the mean of the volume data over time gives a descriptive statistic for the whole brain representing the 3D mean volume.
To take the mean over time (which is the first dimension) we just have to specify the axis:
    data_mean = transposed_data.mean(axis=0) #axis=0 specifies axis as time, the first (0) dimension
    print(data_mean.shape)
    data_mean
Masking
The last important technique for subsetting data from an array is masking.
How do we mask an array? Masking involves creating a boolean array (True/False) version of the data array where values corresponding to True masks are kept and values corresponding to False masks are not. The masking array must be the same size as the data array so that the indices match up.
Masks can also be created using binary operators (>, <, ==, !=). This helps with larger arrays where typing out all of the True/False values can get really tedious. It also allows us to analyze or filter the values of the array by some condition.
What’s the point of masking?
Masking allows for selecting certain indices, like indexing, which reduces dimensionality: masked arrays have to be returned in a single dimension because after masking, the resulting array elements are no longer necessarily in a form that fits exactly into the original multiple dimensions.
We can use masking in fMRI data as a pre-processing step, using it to get rid of unwanted voxels or to get just a subset of the voxels we are interested in (for example just data from a certain part of the brain).
To figure out what data we are actually interested in, let’s plot a histogram of all of the data.
    _ = plt.hist(transposed_data.flatten(), bins=20)
    plt.xlabel('Raw fMRI Activity')
    plt.ylabel('TRs (count)') #note: TR is the sampling rate
INSERT OUTPUT IMAGE HERE
From the histogram, we see that there is a large peak near 0 and another smaller bump around 1000. The values close to 0 are actually from outside of the brain, where the low signal values are caused by external things like air. So we aren’t actually interested in the data there.
So how can we extract the data from only the region of the scan that contains brain data? Masking!
If we can determine a bottom threshold for the data we are interested in, we can filter out the non-brain data using a boolean mask! Let’s take a closer look at a more specific range of the histogram:
    _ = plt.hist(transposed_data.flatten(), bins=100, range=(100, 1500))
    plt.xlabel('Raw fMRI Activity')
    plt.ylabel('TRs (count)')
INSERT OUTPUT IMAGE HERE
Ok so by setting the range as 100 to 1500, we cut off most of the low signal range data and we can see the main brain data bump better. It looks like the plot as a second peak at around 700 to 1300, so we can set 700 as our low threshold.
threshold = 700
Next, we have to determine which volume to threshold- this is where the mean volume comes in. If we picked an individual volume, it could have noise fluctuations that bias its value. However, the volume is resistant to fluctuations. So, let’s mask the mean 3D volume array data_mean from before so that only voxels whose mean activity is above the threshold are kept.
    masked_data = data_mean > threshold
    print(f'There are {masked_data.sum()} voxel activity values above the threshold.')

    ## The output should read: There are 48665 voxel activity values above the threshold.
Now let’s visualize the mask! We’ll use a specifc function to create an interactive plot that shows one axial slice of the 3D mask at a time. Use the sliding bars to move through the brain slices!
    from ipywidgets import interact, interactive, fixed, interact_manual, widgets
    def plotMask(i):
        plt.figure(figsize=(9,9))
        plt.imshow(masked_data[i,:,:], cmap="gray", vmin=0, vmax=1)
        plt.axis('off')

    num_axial_slices = masked_data.shape[0]
    _ = interact(plotMask, i=widgets.IntSlider(min=0,max=num_axial_slices-1,step=1,value=num_axial_slices/2))
We can also use a similar function to plot the data directly without a filtering mask:
    def plotData(i):
        plt.figure(figsize=(9,9))
        plt.imshow(data_mean[i,:,:], cmap="gray", vmin=0, vmax=2500)
        plt.axis('off')

    _ = interact(plotData, i=widgets.IntSlider(min=0,max=num_axial_slices-1,step=1,value=num_axial_slices/2))
INSERT OUTPUT IMAGE HERE
Good, the plots look pretty similar!
In summary, we loaded an actual fMRI experimental dataset and reviewed some basic data attribute info. You learned some basic 4D array data manipulation useful for fMRI data including averaging, indexing, and masking. Masking helps filter out unwanted voxels (like non-brain data) or allows us to focus in on specific brain data in a desired range of brain activity. Lastly, we plotted the masked data and the mean volume data in interactive plots to finally take a peak into the visualizable fMRI data!
Visualizing an fMRI Dataset
Thus far, we have been able to simply load a dataset into memory and perform simple manipulation tasks to extract information from the 4D Array. In this module we will go more in depth into the different types of extractable data that can be analyzed from a single FMRI dataset and how to anlyze each of these different forms.
    # Load Data Locally
    # Download data
    url = 'https://github.com/neurotech-berkeley/neurotech-course/blob/master/module_3_fMRI_dataset/sub-control01/sub-control01_func_sub-control01_task-music_run-1_bold.nii?raw=true'
    r = requests.get(url, allow_redirects=True)
    open('sub-control01_func_sub-control01_task-music_run-1_bold.nii', 'wb').write(r.content)
    file_path = './'
    image_path = os.path.join(file_path, 'sub-control01_func_sub-control01_task-music_run-1_bold.nii')
    music_img = nibabel.load(image_path)

    # The original (X, Y, Z, T) dimension
    print("Original Shape: ", music_img.shape)
    # Cache data and transpose (T, Z, Y, X)
    music_data = music_img.get_fdata().T
    print("Transpose Shape: ", music_data.shape)
With the transpose we are able to successfully flip the dimensions of the data to make manipulation easier when trying to select certain Time Steps, Volumes or Cross Sections of the FMRI Data.
FMRI Array Types
With these different dimensions there are numerous combinations that can be utilized to represent different FMRI Array data for different purposes. Here are a few common ones we will be looking at.
(1) Voxel Time Series (1D) - A series of values that represent a single voxel (volumetric pixel) of area within the 3D FMRI Volume data. This voxel has a (X, Y, Z) coordinate that stays constant. These series allow for a single area in the brain to be plotted over time visualizing simple activation data. (2) Slice Plot (2D) - An image that represents a single frame in time and a single plane within the brain. There are defined biological sectional views that will be defined later. (3) Volume Plot (3D) - Either a series of Slice Plots upon a certain axis or an interactive 3D representation of the brain at a single time frame.
These plots can be combined with other dimensions such as time to represent more interactive views of the data. The basic premise behind FMRI is using these visual patterns over time to derive conclusions.
Voxel Selection
There are many forms of extractable data that can be visualized and analyzed from a single Voxel Timeseries FMRI Scan (4D) this is the form that you have been loading thus far. After transposing the data is shaped with the dimensions (T, Z, Y, X) where when looking from the front or “face” of the brain.
(1) T (Time Steps) Each time step measure is taken with some standard sampling rate around 1 to 2 second intervals. Take note when visualizing a timeseries as the index does not coresspond 1 to 1 on the time. (2) Z (Top to Bottom) (3) X (Left to Right) (4) Y (Front to Back)
We will use Voxel Selection techniques to generate a Voxel Time Series plot of a region of interest within the data array.
    # Using Slicing select a single voxel at (Z=21, Y=50, X=51)
    time_series = music_data[:, 21, 50, 51]
    print(time_series)

    # Line Plot
    plt.plot(time_series)
    plt.xlabel('Time (TRs)')
    plt.ylabel('BOLD Signal (a.u.)')
This voxel plot is very random for now but as we apply further preprocessing analysis techniques we will be able to better understand activation sites and patterns that occur within them.
Sectional slicing
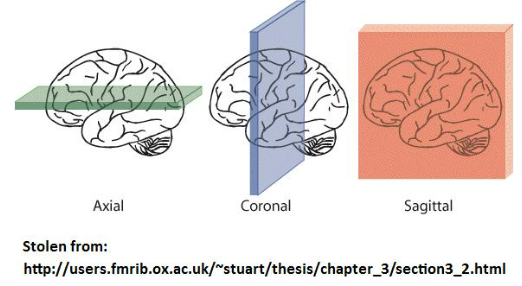
From voxel timeseries plots the next most popular visualization is the set of sectional 2D plots of the brains. There are a set of terms to describe the three most medically common views. All these views have the temporal dimension fixed and one other coordinate fixed.
(1) Axial (or horizontal) slice: plane in (X,Y)
    # Basic Axial Slice (Set Z fixed)
    slice_axial = music_data[5, 30, :, :]
    fig = plt.figure(figsize=(10, 10))
    im = plt.imshow(slice_axial)
(2) Coronal slice: plane in (X,Z)
    # Basic Coronal Slice (Fixed Y)
    slice_sagittal = music_data[5, :, 40, :]
    # Flip View on (Z, X) Due to Indexing
    slice_sagittal = np.flip(axis=(0,1), m=slice_sagittal)
    fig = plt.figure(figsize=(10, 10))
    im = plt.imshow(slice_sagittal)
(3) Sagittal slice: plane in (Y,Z)
    # Basic Sagittal Slice (Fixed X)
    slice_sagittal = music_data[5, :, :, 40]
    # Flip View on (Z, Y)Due to Indexing
    slice_sagittal = np.flip(axis=(0,1), m=slice_sagittal)
    fig = plt.figure(figsize=(10, 10))
    im = plt.imshow(slice_sagittal)
INCLUDE IMAGE OF THESE SLICES
Volume Visualization
Using a combination of techniques applied above and the use of interactive python elements one could create a sectional Volume Map of an fmri at a certain time point. We will be utilizing subplots to plot a set of plots for a certain sectional view.
    # Axial Slices
    plt.figure(figsize=(50, 60))
    for i in np.arange(music_data.shape[1]):
        plt.subplot(10, 5, i + 1)
        slice_axial = music_data[5, :, :, i]
        slice_axial = np.flip(axis = (0, 1), m = slice_axial)
        plt.imshow(slize_axial)
        plt.axis('off')
    plt.suptitle("Axial Slices")
    plt.tight_layout()

    # Sagittal Slices
    plt.figure(figsize=(50, 60))
    for i in np.arange(music_data.shape[3]):
        plt.subplot(10, 8, i + 1)
        slice_sagittal = music_data[5, :, :, i]
        slice_sagittal = np.flip(axis = (0, 1), m = slice_sagittal)
        plt.imshow(slice_sagittal)
        plt.axis('off')
    plt.suptitle("Sagittal Slices")
    plt.tight_layout()

    # Coronal Slices
    plt.figure(figsize=(50, 60))
    for i in np.arange(music_data.shape[2]):
        plt.subplot(10, 11, i + 1)
        slice_coronal = music_data[5, :, :, i]
        slice_coronal = np.flip(axis = (0, 1), m = slice_coronal)
        plt.imshow(slice_coronal)
        plt.axis('off')
    plt.suptitle("Coronal Slices")
    plt.tight_layout()
If you have a further interest in complex visualization check out the pycortex library. The library has much more complex visualization algorithms that can be applied that dont work natively in these colabs.